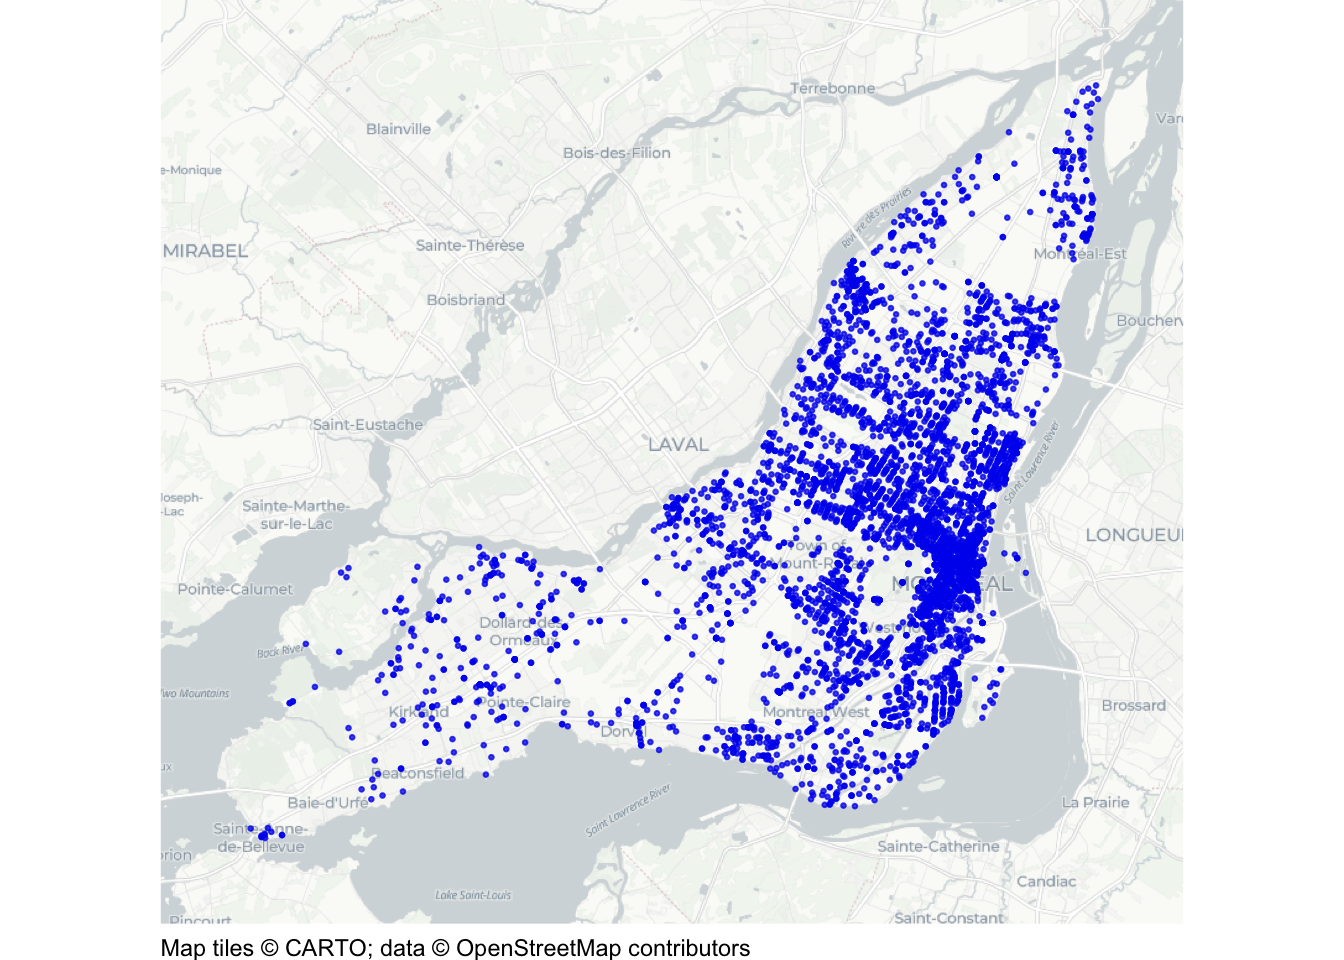
This document walks through a specimen answer to this exercise. Read each code section and its numbered explanations below. Select the number at the start of each explanation to highlight the line of code that explanation relates to.
In R, like in many programming languages, there is usually more than one way to complete a task. This code shows one way to complete this exercise. There are other ways to organise this code that are equally good and achieve the same result, but the code below tries to balance making the code efficient with making it easy to read. If your code is different from the code here, read through the notes below the answer and use those to decide whether you prefer your own approach or the specimen answer below. You can also use the notes to improve your own code.
WarningThe specimen answer expects your computer to be set up as outlined in the book.
<httr2_response>
GET https://mpjashby.github.io/crimemappingdata/montreal_mefait.csv.gz
Status: 200 OK
Content-Type: application/gzip
Body: On disk '/Users/mattashby/Documents/Crime Mapping Book/exercises/data/raw/montreal_mefait.csv.gz' (781438 bytes)
Rows: 54040 Columns: 5
── Column specification ────────────────────────────────────────────────────────
Delimiter: ","
chr  (2): categorie, quart
dbl  (2): x, y
date (1): date

ℹ Use `spec()` to retrieve the full column specification for this data.
ℹ Specify the column types or set `show_col_types = FALSE` to quiet this message.
NoteView the complete R script
# Map recorded damage to property (méfait) in Montreal in 2025.# Load the packages needed for downloading, preparing and mapping the datapacman::p_load(here, httr2, sf, sfhotspot, tidyverse)# Download the original compressed CSV file and keep a local copyrequest("https://mpjashby.github.io/crimemappingdata/montreal_mefait.csv.gz") |># Save the file in the workspace's data/raw folderreq_perform(path =here("data", "raw", "montreal_mefait.csv.gz"))# Locate the downloaded file within the workspacemefait_2025 <-here("data", "raw", "montreal_mefait.csv.gz") |># Read the compressed CSV file, including its date columnread_csv() |># Convert column names to snake_case janitor::clean_names() |># Keep dates from 1 January to 31 December 2025 inclusivefilter(date >=ymd("2025-01-01"), date <=ymd("2025-12-31")) |># Interpret x and y as projected coordinates in metres using EPSG:2950st_as_sf(coords =c("x", "y"), crs ="EPSG:2950")# Draw a point map over a base map, with small, partly transparent pointshotspot_map( mefait_2025,basemap_type ="cartolight",alpha =0.25,colour ="blue2",size =0.5)
1# Map recorded damage to property (méfait) in Montreal in 2025.
1
Explain that the script maps recorded damage to property, known as méfait in the source data, in Montreal in 2025. This identifies the task without requiring us to read the rest of the script. See Organising code with comments.
Step 2: Load packages
# Load the packages needed for downloading, preparing and mapping the data2pacman::p_load(here, httr2, sf, sfhotspot, tidyverse)
2
pacman::p_load() loads the packages needed for this analysis, listed in alphabetical order with the tidyverse package last. here allows us to specify where to find files in the workspace; httr2 downloads data from the internet; sf handles spatial objects; sfhotspot creates crime maps and estimates density; tidyverse provides tools for reading, wrangling and plotting data. Loading packages at the start makes it easy to check which tools the script needs. See Loading packages.
Step 3: Download the original data
# Download the original compressed CSV file and keep a local copy3request("https://mpjashby.github.io/crimemappingdata/montreal_mefait.csv.gz") |># Save the file in the workspace's data/raw folder4req_perform(path =here("data", "raw", "montreal_mefait.csv.gz"))
3
request() specifies the URL of the file to download. The pipe operator (|>) passes that request to the next function. The downloaded file is a compressed CSV (.csv.gz). We can read this format directly with read_csv(), so there is no need to extract it first. See Downloading and loading data; Stringing functions together.
4
req_perform() performs the download that was set up by request(). here() specifies where the original file should be saved, relative to the crime_mapping workspace. Keeping the original data in data/raw means we can return to it if we make a mistake while wrangling the data. See Keeping your files organised.
Step 4: Load and prepare the incidents
# Locate the downloaded file within the workspace5mefait_2025 <-here("data", "raw", "montreal_mefait.csv.gz") |># Read the compressed CSV file, including its date column6read_csv() |># Convert column names to snake_case7 janitor::clean_names() |># Keep dates from 1 January to 31 December 2025 inclusive8filter(date >=ymd("2025-01-01"), date <=ymd("2025-12-31")) |># Interpret x and y as projected coordinates in metres using EPSG:29509st_as_sf(coords =c("x", "y"), crs ="EPSG:2950")
read_csv() from readr reads the compressed CSV file and recognises its date column as dates. See Loading CSV data.
7
janitor::clean_names() from janitor converts column names to snake_case. Using :: allows us to use this function without loading the whole package. See Cleaning column names; Loading packages.
8
filter() from dplyr keeps dates on or after 1 January 2025 and on or before 31 December 2025. Both conditions must be satisfied. ymd() from lubridate converts the text into dates. The file covers several years, but every row already relates to méfait, so only the year needs filtering. See Filtering rows.
9
st_as_sf() converts an ordinary object into a spatial object which specifies how the coordinates in the data correspond to locations of the earth. The argument coords = c("x", "y") specifies that the numeric coordinates describing each location are stored in the columns x and y. The argument crs = "EPSG:2950" describes how those coordaintes relate to places on the Earth’s surface. Note that we know which code to use for the crs argument because that was specified in the exercise instructions. See Converting data to an SF object.
Step 5: Draw the map
# Draw a point map over a base map, with small, partly transparent points10hotspot_map(11 mefait_2025,12basemap_type ="cartolight",13alpha =0.25,14colour ="blue2",15size =0.5)
10
hotspot_map() draws the spatial points over a base map. The arguments below then control how the points appear. Note that the result of this function is not stored in an object using <-, so running it causes the result (in this case, the map) to be displayed directly on the screen. See Drawing the map.
11
Base the map on the 2025 data object created in the previous step.
12
Choose the light cartolight style of base map to provide local context without visually competing with the points showing damage to property. See Base maps.
13
There are many crimes to show, so points may overlap. alpha = 0.25 makes them partly transparent so that areas containing more overlapping points appear more prominent (although we will several better ways to solve this problem). See Controlling aesthetics.
14
Blue points contrast with the light background. The incidents should stand out more than the features shown on the base map. See Visual hierarchy.
15
Use small points with size = 0.5 so that nearby incidents do not obscure one another as much.